Briefing • 13 December 2013
Briefing 10 : What happened to the richest?
Download the full pdf here.
Explaining the data
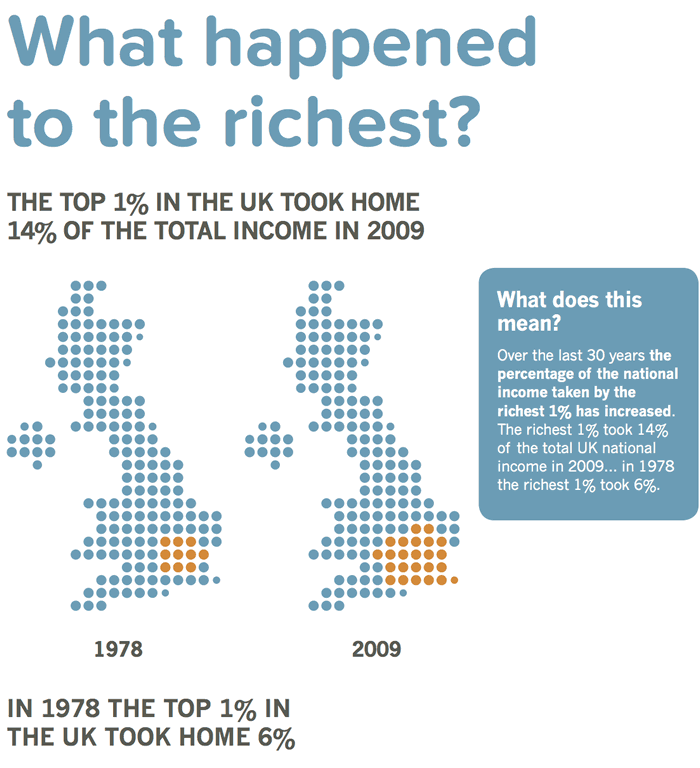
Here we have relied upon data produced for the World Incomes Database at the Paris School of Economics. It is all available online http://topincomes.g-mond.parisschoolofeconomics.eu. This data relates to 2009 as it is the most up-to-date data available. We then relate it to 1978 as this was the year in which income disparity was at its lowest. We have rounded figures to the nearest whole number for clarity, but for accuracy the top 1% took 13.9% of the national income in 2009 and 5.72% in 1978.
Tagged under: income inequality
Don’t miss out – subscribe to our FREE weekly briefing.
Recent briefings
- Briefing 65: Privately educated children earn more than state-educated children with the same grades
- Briefing 64: There are more disadvantaged children in Britain than in many other advanced economies
- Briefing 63: Reducing inequality doesn’t harm the economy
- Briefing 62: Rising inequality has reduced the UK’s economic growth
- Briefing 61: Regional inequality in the UK is the worst in Western Europe


